Feature Highlight Dashboard Series - Part 5: Configuring Dashboards for Executive Users
The dashboard is an essential tool available to users in the following iCIMS' solutions:
- iCIMS Connect (Legacy CRM)
- iCIMS Applicant Tracking (ATS)
- iCIMS Offer Management
- iCIMS Onboarding
Dashboards can be configured to create effective landing pages for your users, displaying key metrics, frequently used reports, and important to-do items immediately upon logging in. User admins can set up unique, role-oriented dashboards for different user groups to help boost their team's overall efficiency and improve their user experience within the system. This installment of the Feature Highlight Dashboard Series provides recommendations for configuring an impactful dashboard for executive users.
Tip: Don't forget to check out the other articles in the series, such as Dashboard Management, for additional tips and recommendations. The full list of articles within the series is available in the Feature Highlight Dashboard Series section of this article.
The Executive User Dashboard
The dashboard is one of the most essential tools for executive users of the iCIMS system. Unlike the action-oriented dashboards for users who work within the system (e.g. recruiters), the executive user dashboard provides insight into an organization's recruitment efforts by highlighting key metrics and linking to important reports. While different organizations may display different metrics on the dashboard depending on their unique needs, the goal of creating an easy-to-access central hub of recruitment data remains the same. The key to creating an effective executive user dashboard is to streamline the widgets included and focus on displaying only the necessary information a user needs. Too much information can overwhelm a user that does not interact with the system on a daily basis, and the presence of unneeded or unimportant details can distract the user from retrieving the metrics they need.
Dashboard Panels & Widgets for Executive Users
Above is an example of a dashboard tailored specifically for an executive user that utilizes the three column layout. This dashboard uses three types of panels to easily convey at-a-glance information: key metric (which can display data as charts, if desired), factoids, and button links. Information displayed includes an overview of jobs opened and filled during the year, applicant and hire metrics, recruitment metrics such as time-to-fill, and links to EEO reports. From the dashboard, the executive user can easily access the data they need without delving into the system; all the essential information needed is available immediately upon logging in. The panels and widgets displayed on this dashboard are outlined below.
Column 1: Jobs Overview
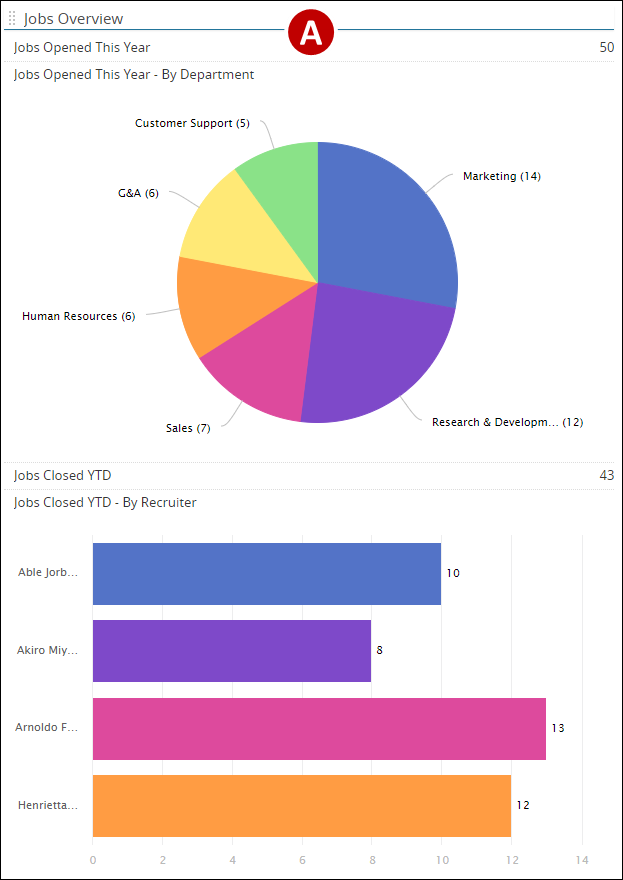
This column contains widgets that provide an overview of jobs opened and filled during the current year across various segments.
Panel A: Jobs Overview
Type: Key Metric
Widget(s): This panel contains several key metric widgets displaying job metrics. Key metric widgets can be displayed as either a simple name and number or as charts, depending on how users would prefer to view data. Keep in mind that a search template must contain at least one level of grouping in order to display as a chart. The widgets included in this panel are:
-
Jobs Opened This Year - This widget displays the number of jobs opened year-to-date. To create this metric, build and save a Job search with the following criteria:
-
Jobs Opened This Year - By Department - This widget displays jobs opened year-to-date broken down by department. To create this metric, build and save a Job search with the following criteria:
-
Jobs Closed YTD - This widget displays the total number of jobs closed and filled during the current year. To create this metric, build and save a Job search with the following criteria:
-
Jobs Closed YTD - By Recruiter - This widget displays the number of jobs closed during the current year separated by the recruiter for each job. To create this metric, build and save a Job search with the following criteria:
Tips:
-
To pull information from multiple closed- or open-status folders in any of the above widgets, add the corresponding Date Last in... filter for each desired folder and set the filter logic to Any instead of All.
-
If your organization has multiple openings per Job profile, add # of Openings as a column and group by Total. When creating the dashboard widget, select # of Openings in the Summarized Data field.
-
Other metrics to display in this panel could include jobs denied (not approved) during the year, jobs on hold, or jobs opened/closed grouped by other segments, such as region or level.
Column 2: Hire Metrics
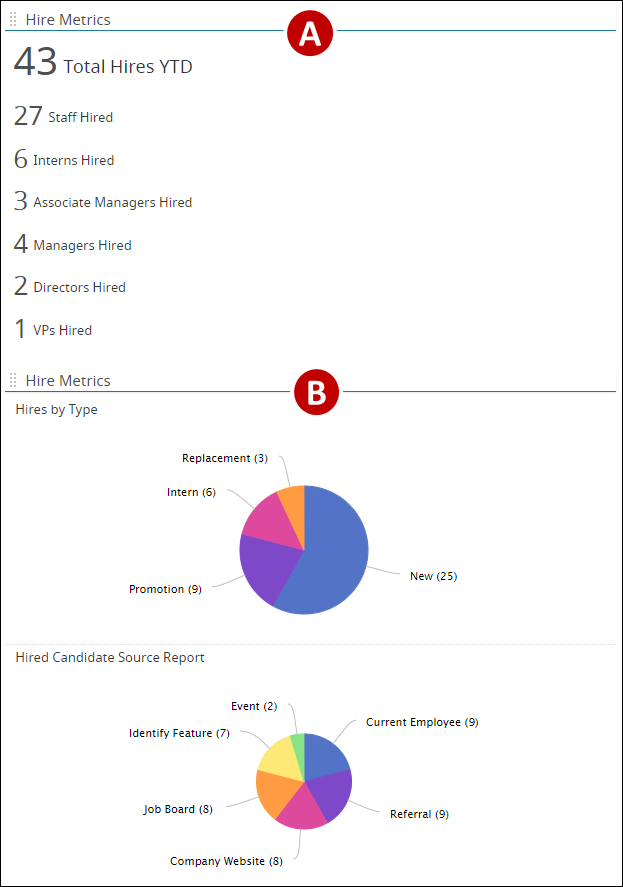
This column contains panels and widgets that display metrics related to various details about hires made during the year.
Panel A: Hire Metrics
Type: Factoid
Widget(s): This panel contains several factoid widgets listing the total number of hires made to date, as well as the breakdown of hires by level. (Each level is represented by its own factoid.) Factoids display the total count of search results from the underlying search template followed by custom text. With the custom text, factoids can be used to provide summary data that clearly convey a desired message. The factoid widgets displayed on this panel include:
-
Total Hires YTD - This factoid displays the total hires made during the current year. To create this factoid, build and save a Recruiting Workflow search using the following criteria:
-
Hires per Level - These six factoids display the total number of hires made at each level (staff, manager, etc.). An individual search template is needed to create each factoid. To create factoids of this style, build and save Recruiting Workflow searches with the following criteria:
-
Filter: Last in Hired:Hired set to This Year (or other desired time frame)
-
Filter: Job: Level set to one of the desired levels, such as manager.
Tips:
-
To capture data for multiple statuses, add the Last in...filter for each desired status and set the filter logic to Any instead of All. To combine multiple statuses with other filters (such as Level), place the status-related filters into their own filter subgroup and set the subgroup's filter logic to Any instead of All.
-
Individual templates for each level (or other segment) are needed to create each factoid. As factoids display the total count of search results, selecting multiple levels within a single template will result in a factoid displaying the total count across all levels selected rather than per level.
Panel B: Hire Metrics
Type: Key Metric
Widget(s): This panel contains key metric widgets displaying additional information related to hires made during the year. The widgets contained in this panel include:
-
Hires by Type - This widget displays hires made during the year broken down by hire type. To create this widget, build and save a Recruiting Workflow search with the following criteria:
-
Hired Candidate Source Report - This widget displays the primary source that each hire (made this year) came from when applying for the job for which they were hired. To create this widget, build and save a Recruiting Workflow search with the following criteria:
Other widgets to include in this panel could include hires by FLSA status, department, or recruiter, as well hires made per month.
Column 3: EEO Reports and Recruitment and Applicant Metrics
This column contains panels and widgets that display key recruitment metrics, such as time-to-fill, links to EEO reports, and essential applicant data.
Panel A: Efficiency Metrics
Type: Key Metric
Widget(s): The widgets contained in this panel highlight key metrics relating to your organization's recruitment efforts. The widgets included in this panel include:
-
Time-to-Fill (AVG) - This widget displays the average time-to-fill in days across all hires made to date. To create this widget, build and save a Recruiting Workflow search with the criteria below. Then, when creating the dashboard widget, select Time-to-Fill Since Creation (AVG) in the Summarized Data field.
-
Time-to-Hire (AVG) - This widget displays the average time-to-hire in days across all hires made to date. To create this widget, build and save a Recruiting Workflow search with the criteria below. Then, when creating the dashboard widget, select Time-to-Hire Since Identified (AVG) in the Summarized Data field.
-
Time to Complete Application (AVG) - This widget displays the average amount of time (in minutes) candidates took to complete the online portal application process. To create this widget, build and save a Recruiting Workflow search with the below criteria. Then, when creating the dashboard widget, select Time to Complete Application Steps (AVG) in the Summarized Data field.
-
Filter: Application Date set to This Year (or other desired time frame)
-
Filter: Current Application Step set to Application Completed
-
Filter: Time to Complete Application Steps (Minutes) set to greater than 0
-
Column: Time to Complete Application Steps (AVG)
-
Group-By: Total
Panel B: EEO Reports
Type: Button
Widget(s): This panel contains button widgets linking to various EEO reports. Button widgets link the user directly to search results for the saved report so the user doesn't need to find the desired template or recreate the search from scratch. Button links are useful for reports that cannot be easily summarized by a key metric, and when the full search results need to be reviewed. The widgets included in this panel include:
-
Job EEO Category Report - This report provides a list of jobs approved during the current year broken down by EEO Category. To create this widget, build and save a Job search with the following criteria:
-
Applicant EEO Report - This report provides EEO data about all candidates who applied during the current year. The report uses multiple levels of grouping to provide race and gender information for candidates that applied to jobs within each job EEO category. To create this widget, build and save a Recruiting Workflow search with the following criteria:
-
Filter: Application Date set to This Year (or other desired time frame)
-
1st Level Group-By: Job: EEO Category
-
2nd Level Group-By: Person: Race
-
3rd Level Group-By: Person: Gender
-
Hires EEO Report - This report provides the same information as the Applicant EEO Report but narrows down the results to only candidates that were hired. To create this widget, build and save a Recruiting Workflow search with the following criteria:
-
Filter: Last in Hired:Hired set to This Year (or other desired time frame)
-
1st Level Group-By: Job: EEO Category
-
2nd Level Group-By: Person: Race
-
3rd Level Group-By: Person: Gender
Panel C: Applicant Metrics
Type: Key Metric
Widget(s): This panel contains key metric widgets that display essential data relating to candidates that applied during the year. The widgets included in this panel include:
-
Total Applicants YTD - This widget displays the total number of candidates that submitted applications during the current year. To create this widget, build and save a Recruiting Workflow search with the following criteria:
-
Total Interviews Held - This widget displays the total number of candidates that reached the interview stage of the recruitment process. To create this widget, build and save a Recruiting Workflow search with the following criteria:
-
Total Offers Extended - This widget displays the total number of offers that were extended to candidates during the year. To create this widget, build and save a Recruiting Workflow search with the following criteria:
-
Total Offers Declined - This widget displays the total number of offers that were declined by candidates during the year. To create this widget, build and save a Recruiting Workflow search with the following criteria:
-
Total Employee Referrals - This widget displays the total number of candidates who applied during the year that were employee referrals. To create this widget, build and save a Recruiting Workflow search with the following criteria:
-
Source Report - This widget displays the primary source for each candidate that applied to a job during the current year. To create this widget, build and save a Recruiting Workflow search with the following criteria:
Feature Highlight Dashboard Series
The 5-part Feature Highlight Dashboard series provides tips and best practices for creating and managing effective dashboards for different types of users of the iCIMS system. Topics covered include how to set up unique dashboards for different user groups by adding and arranging new panels and widgets. The series also provides example reports and widgets tailored to different roles that help boost efficiency, streamline the overall user experience, and promote ease of use and adoption by users. The articles within the series are listed below:
Additional Resources

