Overview
The dashboard is the initial screen that displays for users after logging in to any of the following iCIMS solutions:
- iCIMS Connect (Legacy CRM)
- iCIMS Applicant Tracking (ATS)
- iCIMS Offer Management
- iCIMS Onboarding
The dashboard serves as the central hub for users' recruiting activity and provides a launching off point for the iCIMS system. The dashboard consists of configurable panels and widgets that leverage saved search templates to display important information to users, such as candidates ready for review or jobs in need of approval. Via these panels and widgets, dashboards can be configured to create effective landing pages for your organization's users, displaying key metrics, frequently used reports, and important to-do items immediately upon logging in.
User admins can configure dashboards globally or per-login group; individual users with the appropriate permissions can also tailor their own dashboard for a personalized view. Users must be given access on a per-login group basis to be able to manage or configure their own dashboard. By default, hiring managers and vendors do not have access to make configurations to their dashboard.
This article contains the following sections:
Navigating the Dashboard
Review the following labeled screenshot and following list for some basic information about navigating the dashboard.
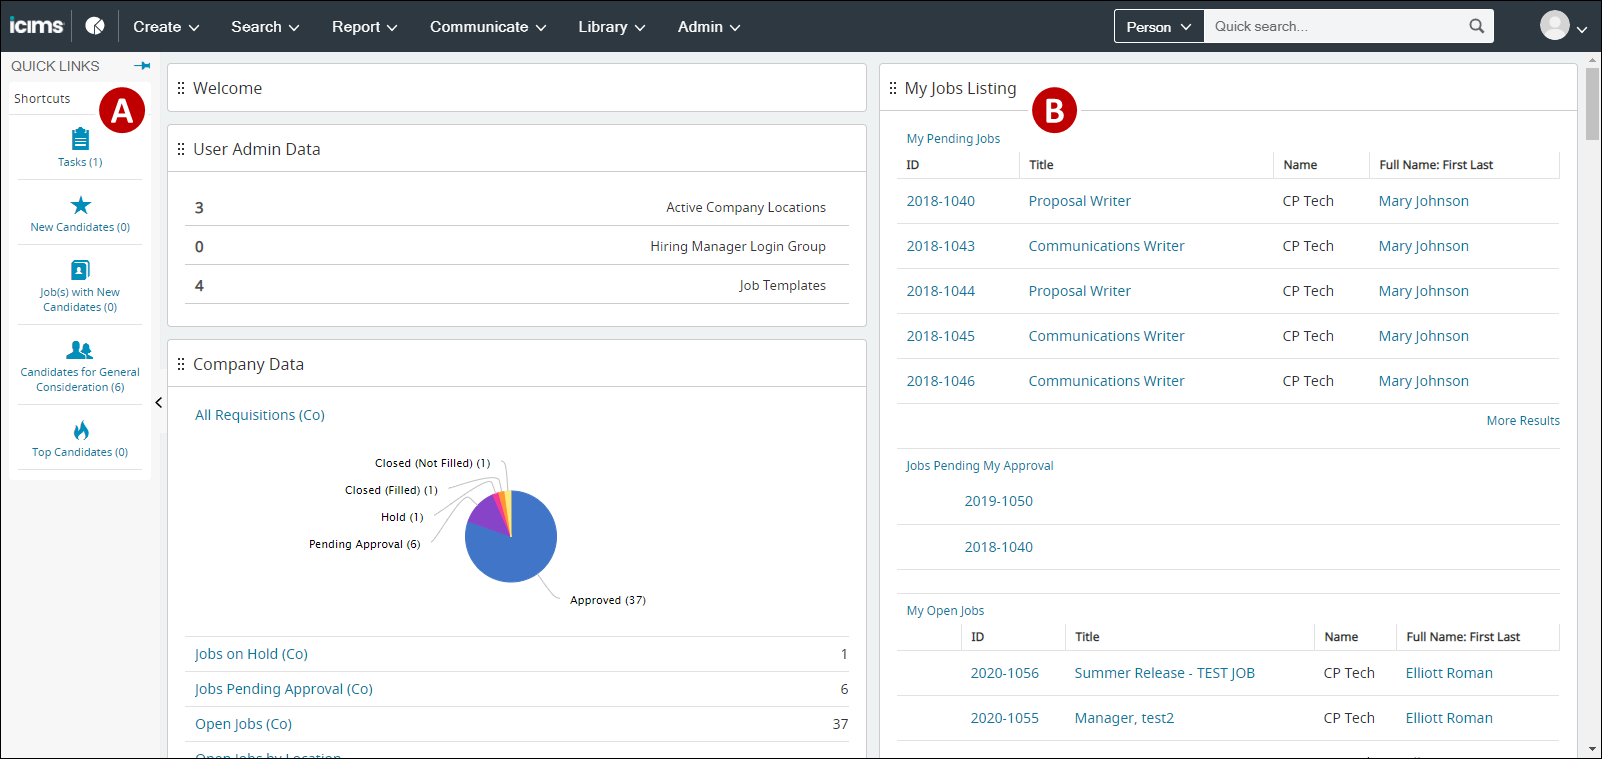
- Quick Links: The Quick Links menu displays links to selected reports fueled by search templates that have been saved to the iCIMS system.
- Dashboard panels: Dashboard panels provide an at-a-glance view of key data from the system. Each panel is made up of one or more widgets that can display data in various ways, such as via charts, factoids, links to reports, or search result previews; the type of panel used dictates how information is presented in the panel's widgets.
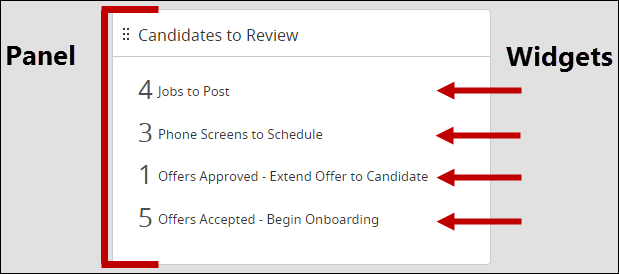 An example of a dashboard panel containing four factoid widgets that are fueled by saved search templates
Understanding Panel Types
Information is displayed on the dashboard via panels and widgets. Each panel on the dashboard contains one or more widgets that present specific data to users.
The type of panel used dictates how the information on the panel is displayed to users. For example, a chart-type panel can only contain widgets that display data to users via charts and graphs.
Eight panel types are available within the iCIMS system to present different types of data to users via the dashboard; these panel types are defined below.
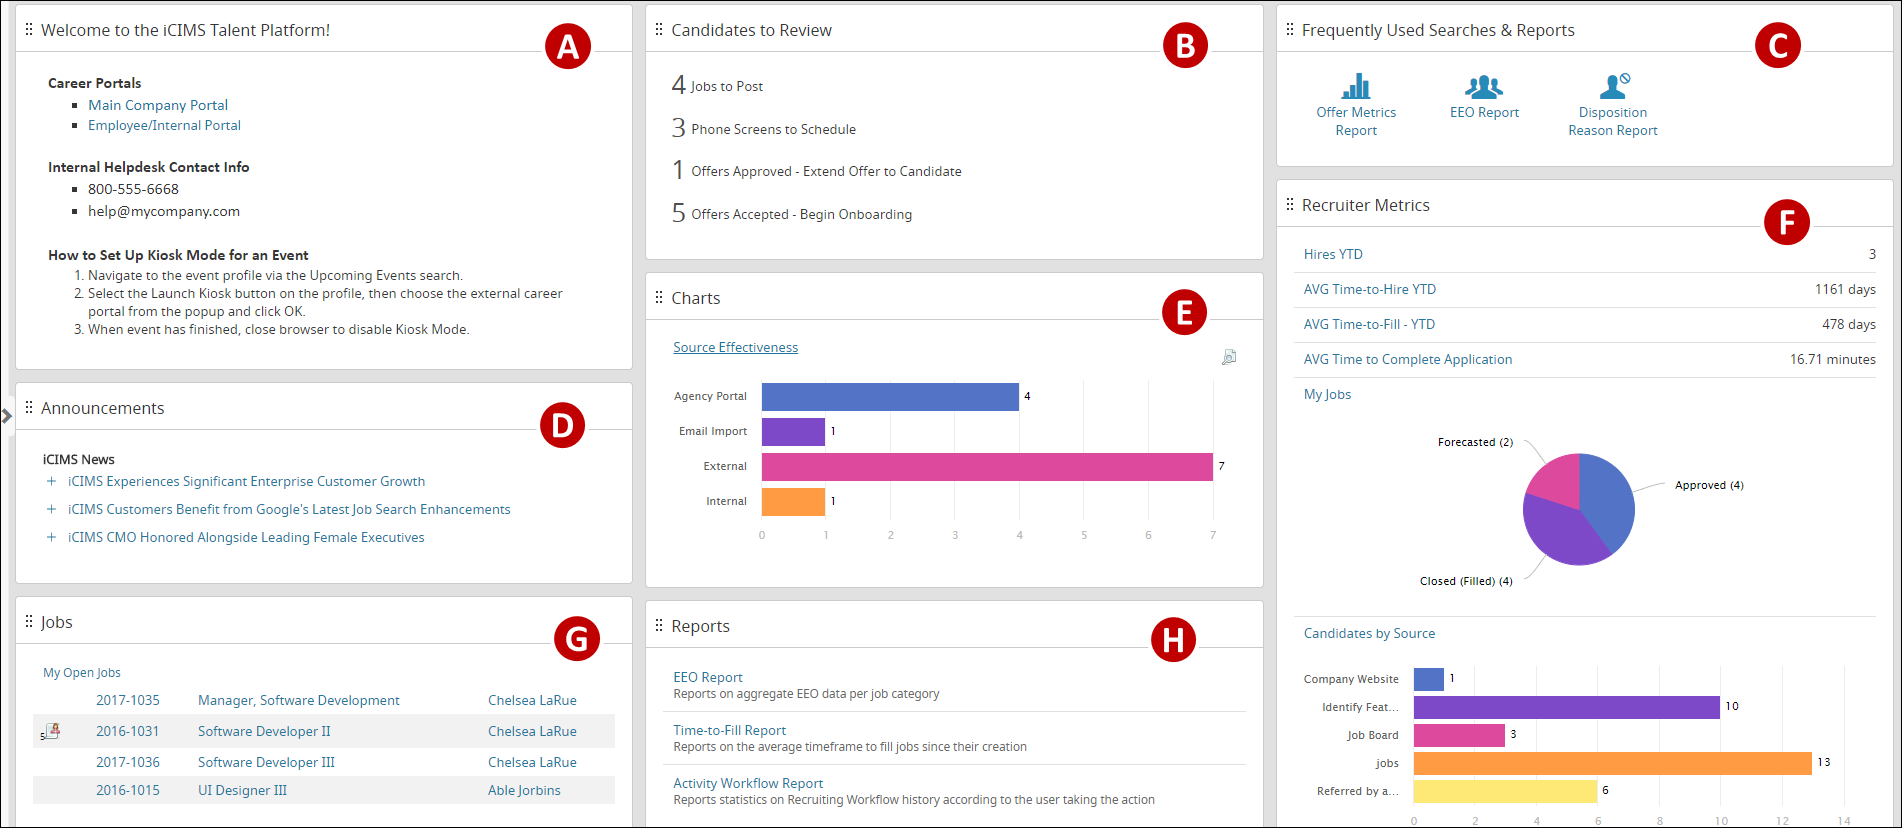
- Text panel: Contains widgets that display static text, images, or HTML
- Factoid panel: Contains widgets that display the count of results from an underlying search template along with a configurable text label
- Button panel: Contains widgets that display icons that link to saved reports (i.e., search templates)
- RSS panel: Contains widgets that display RSS feeds that can link to external information
- Chart panel: Contains widgets that display information as configurable graphs and charts; the title of each widget links to the full search results for the underlying search template
- Key Metric panel: Contains widgets that display important data and metrics as search result counts or configurable graphs and charts
- Search Preview panel: Contains widgets that display a preview of search results from an underlying search template; the title of each widget links to the full search results for the underlying search template
- Report panel: Contains widgets that display clickable links to saved reports (i.e., search templates)
Note: Panels and widgets can only reference search templates that have already been created and saved to the iCIMS system. For more information, review the
Saving Search & Output Templates article.
Accessing and Editing the Quick Links Menu
The Quick Links menu is a collapsible panel that displays buttons that link to saved reports (i.e., search templates). Users can access the Quick Links menu from nearly any screen within the iCIMS system; the menu's availability is not limited to only the dashboard.
Accessing the Quick Links Menu
By default, the Quick Links menu is collapsed to provide users with a larger workspace within the iCIMS system. The menu can be temporarily accessed by hovering over the arrow on the vertical gray bar located to the left edge of the screen.
The Quick Links menu can also be pinned so that it is always displayed on the screen, regardless of where a user currently is within the iCIMS system. To pin the Quick Links menu to the left of the screen, follow the steps below:
- Hover over the arrow on the vertical gray bar located to the left edge of the screen until the Quick Links menu displays (about one second).
- Select the Pin to Sidebar (pushpin) icon located to the top right of the Quick Links menu. Once the menu is pinned, the icon points directly left.
- Tip: To unpin the Quick Links menu, select the Pin from Sidebar (pushpin) icon again. When the menu is unpinned, the icon points downwards.
Adding Items to the Quick Links Menu
The Quick Links menu contains buttons that link to saved search templates. To add a new button to the menu, follow the steps below.
Note: A search template must first be created and saved to the iCIMS system before it can be referenced by the Quick Links menu.
- In the Quick Links menu, hover over the Shortcuts header until the Edit, Refresh, and Collapse icons display. Select the Edit (pencil) icon to manage the Quick Links menu.
- Note: The header label (i.e., Shortcuts) is configurable and may be renamed in your system; however, the header will always be located at the top of the icon list within the Quick Links menu.
- With Shortcuts selected in the left menu, select the green Create New Item (plus sign) icon to add a new button to the Quick Links menu.
- Enter a name for the new button in the Name field.
- Select the down arrow icon beside the Button Icon field and select an icon to represent the new button in the Quick Links menu.
- From the Search Template dropdown menu, select the desired search template for the new button will link to.
- Note: If the desired search template is not available in the dropdown menu, confirm that the template has been saved and shared with your login group. For more information, review the Saving Search & Output Templates article.
- Optional: To share the new button with other login groups, check the appropriate login group boxes from the Share With list. (By default, only the user creating the button has access to it via the Quick Links menu.)
- Select the Save & Exit button to finalize the changes. The new button is then added to the bottom of the Quick Links menu.
- Tip: To change the location of a button within the Quick Links menu, hover over the button until the grip (six dots) icon displays to the top left of the button. Then, select the grip icon and drag the button to the desired location in the menu. (Note: If a user reorganizes their Quick Links menu, their changes will only affect their own view of the menu; their changes will not update any other users' menus.)
Tips:
- The Preview Search Count option allows your button to display the count of search results from the underlying search template. This option can be enabled or disabled when creating a new button or when editing it at a later time.
- Buttons that link to search templates that yield no results are grayed out within the Quick Links menu.
Accessing the Metrics Dashboard
The Metrics Dashboard allows all users to review high-level metrics pertaining to specific areas of their iCIMS system. The summarized information displayed gives users an overview of the data contained within their system and is available across all login groups.
The Metrics Dashboard is separate from a user's personal dashboard and is accessed by selecting the Metrics Dashboard (pie chart) icon on the main menu bar.

Upon selecting the icon, users are brought to iCIMS Applicant Tracking (ATS) metrics by default. Metrics for other products, such as iCIMS Connect (Legacy CRM) and Onboarding may also be available depending on the iCIMS solutions to which your organization subscribes.
iCIMS ATS, Connect, and Onboarding feature several types of metrics, such as Portal, People, Workflow, and Email Campaigns (Connect only). To access these specific metrics, select an iCIMS solution name from the list displayed on the left of the Metrics Dashboard screen, and then select one of the tabs listed at the top of the specific dashboard to the right.
In particular, the Source, Pipeline, and DEI metric dashboard types include the following:
- Getting Started page: Allows users to understand the purpose of the dashboard and where the data comes from.
- Dynamic filters: Allows users to modify what field they are using to generate metrics.
- Drill downs: Allows users to drill into a metric to get more details (where applicable).
Tips:
- Selecting a particular group on the graph will also show the report with that group expanded and all others collapsed.
- Users can filter the search results for some metrics according to particular timeframes, such as Last Year and 1st Quarter. To do so, select one of the options from the drop-down menu in the upper-left corner of applicable charts.
- If you would like to limit user groups' access to the Metrics Dashboard, submit a case to iCIMS Technical Support.
Notes:
- Users cannot configure or rearrange panels or widgets found on the Metrics Dashboard.
- Widgets found on the Metrics Dashboard report results without search results, meaning all users will have access to the same summarized information display in these widgets even if they do not have access to some columns, filters, or data that the search would normally return. However, when running a full search through a widget, the search will be run with the logged-in user's permissions, and results are limited to that user’s search locks. Users who do not have the appropriate permissions will receive the following warning: No results were found. Based on your permissions, actual search results may differ from the original graph or metric.
- Access to the Metrics Dashboard can be enabled or disabled on a per-login group basis.
Additional Resources: Working with Dashboards
The iCIMS Knowledge Base includes the following additional resources on working with dashboards, metrics, and widgets.

