About Time Based Metrics
Time based metrics are measurements used to calculate the time between two specific points in the hiring process. Many different metrics are used in recruiting, including these industry standards:
- Time to Fill: The number of days to fill/close a job after it is opened.
- Time to Hire: The number of days to hire a candidate for a job after that job is opened.
- Time from Apply to Hire: The number of days to hire a candidate for a job after they apply to that job.
By implementing and reviewing metrics such as these, organizations can evaluate the speed and effectiveness of their recruiting, identify any pain points, and determine where they need to improve.
Using the Time Based Metrics Builder
Standard time based metrics like Time to Fill are often defined and calculated differently from company to company. For instance, some organizations believe that a Time to Fill metric should start calculating once a job is approved; others prefer that it begins when the job is first created, even if not yet approved.
To account for these differences, iCIMS offers a Time Based Metrics (TBM) builder, which enables organizations to create and define their own metrics, using specific date/time variables from their system as start and end points. The system will calculate the exact number of days between those two points when the metric is added to reports and profiles, as discussed below in Understanding How Metrics are Calculated.
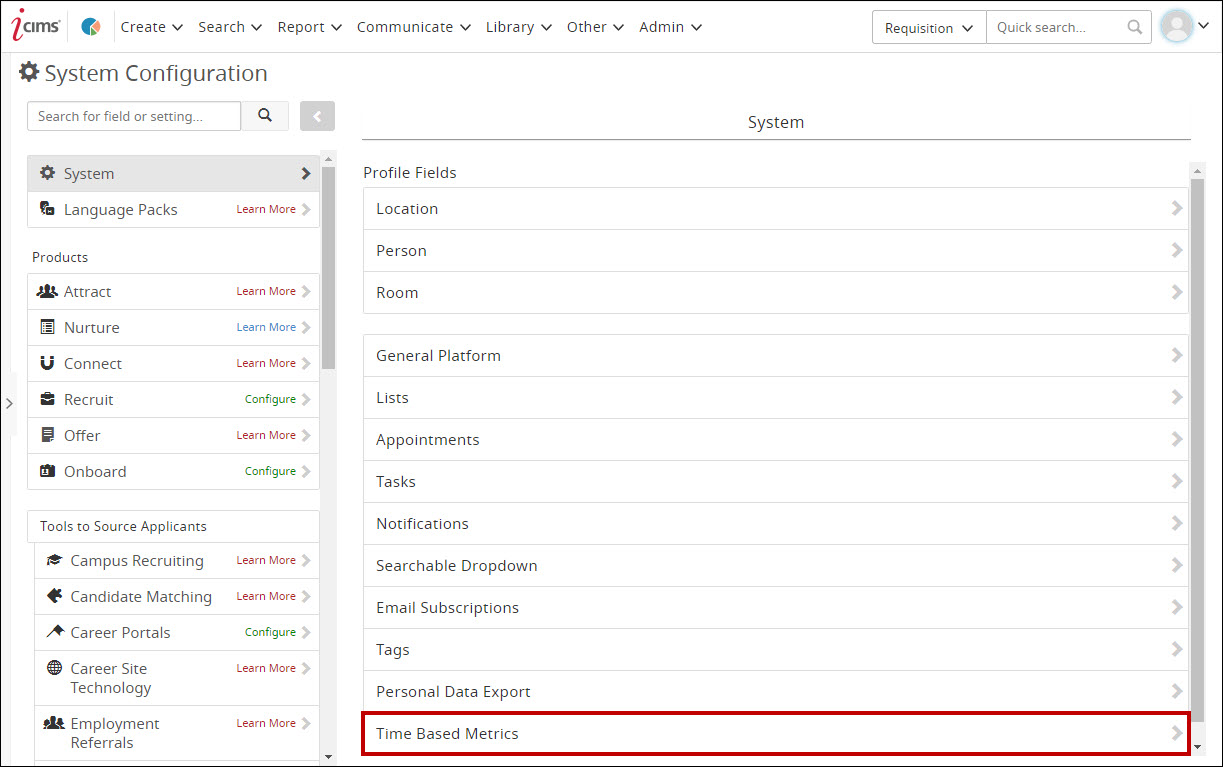
Accessing the Builder
The TBM builder, enabled by default for all customers with iCIMS Recruit, is accessible in the system for user admins only by going to Admin > System Configuration > System and then clicking the Time Based Metrics panel at the bottom.
The TBM page includes two main sections:
- Your Current Metrics: A table of metrics that have been created on this page by the organization. Up to 25 metrics can be included in the table at one time. For more information, see Viewing Current Metrics below.
- Create a New Metric: The form to build a new metric from scratch.
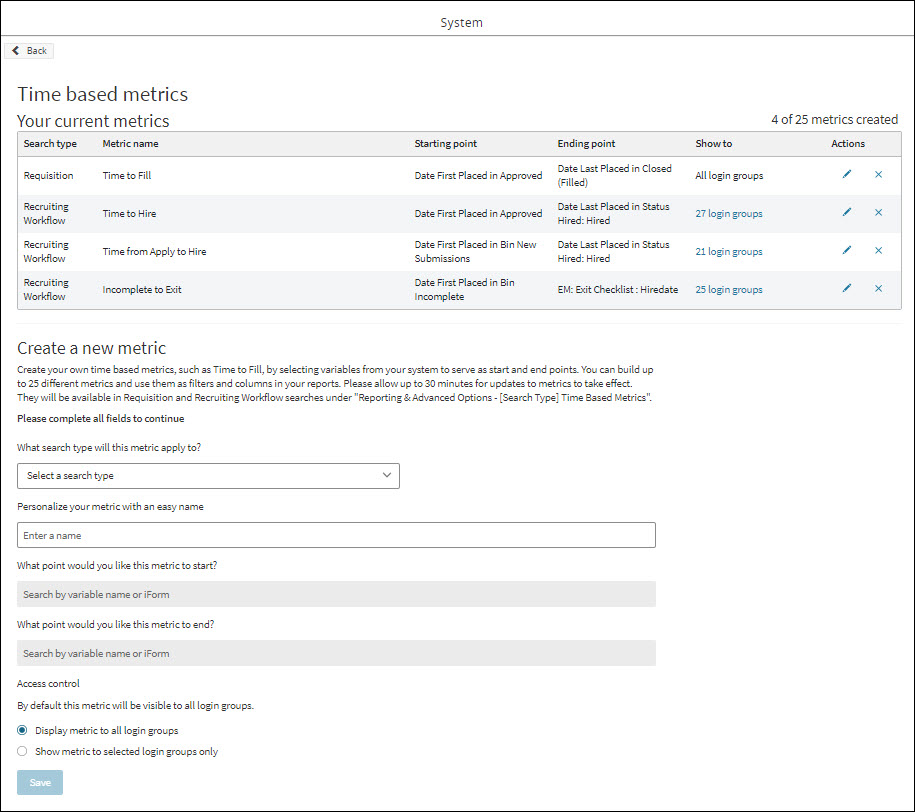
Creating New Metrics through the Builder
To build a new metric, complete the Create a New Metric form and click Save. The Save button only becomes enabled once all fields in the form have been filled in.
Each area of the form is discussed in the sections below.
Selecting a Search Type for the Metric
In the Search Type field on the form, apply the new metric to either a Job or Recruiting Workflow. Metrics are available as filters and output columns in Job and Recruiting Workflow searches, depending on which search type is selected.
Note: The user admin must select one of these search types before proceeding to build their metric.
Entering a Name for the Metric
In the Name field on the form, enter a unique name for the metric. No two metrics can have the same name, and a name cannot exceed 75 characters.
Note: Metrics will display with this name in the filter/column picker on the appropriate search form.
Selecting Start and End Point Variables for the Metric
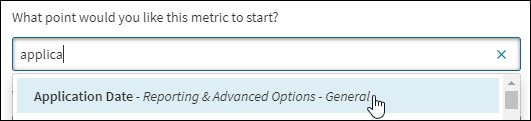
In the Start Point and End Point fields on the form, search for specific date/time variables to serve as the two points for the metric. This is done by:
- Entering the name of a field or variable from the system (e.g., Start Date) and selecting from the list of matching results, or
- Entering the name of an iForm (e.g., Interview Evaluation Form) and selecting from all date/time fields from that form.
To differentiate between variables, the path of each variable in the customer's system displays in the results.
Any date/time variable (Person, Job, Recruiting Workflow) that a user can reference in reporting is available for selection, including:
- Fields from a candidate's Person or Recruiting Workflow profile (e.g., Start Date)
- Fields from a Job profile (e.g., Created Date)
- Person search filters (e.g., Date First in Emp:Active)
- Recruiting Workflow search filters (e.g., Date Last in Hired)
- Job search filters (e.g., Date First in Closed (Filled))
- Fields from an iForm—Person, Recruiting Workflow, or Job (e.g., Form Completed Date, Requested Date)
For example, an organization is building a Job metric for Time to Approve, a metric calculating the number of days to approve a job after it is created. To set up the variables for this metric, its user admin can do the following:
- In the Start Point field, search for Created Date and select the field with that name on a Job profile.
- In the End Point field, search for Date First in Approved and select that particular Job search filter (since they want the metric to end as soon as the job is moved to the Approved job folder).
Notes:
- The Start and End Point variable pickers are disabled until the user selects a search type.
- Changing or blanking out the search type field automatically clears out any variables selected in the Start and End Point fields.
Tips:
- When searching for a field on an iForm in the variable picker, search for the name of the iForm rather than the name of the field. This provides more defined results more quickly.
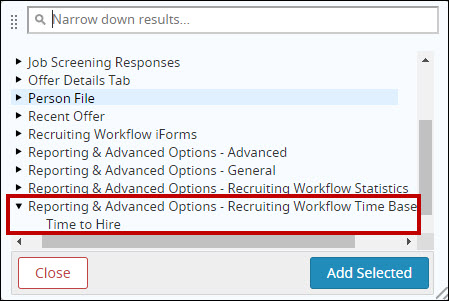
- To select a bin or status as a start and/or end point, set the search type to Recruiting Workflow before entering the variable name in the picker. Select the corresponding variable with the path for "Reporting & Advanced Options - Recruiting Workflow Statistics."
Selecting Login Groups for the Metric
Under Access Control, select one of these two radio buttons to determine who has access to the metric in the system:
- Display metric to all login groups: Select this option to share the metric to all users of the organization's system. This is selected by default.
- Show metric to selected login groups only: Select this option to choose which specific login groups have access to this metric.
If the Show metric to selected login groups only option is selected, a dropdown field displays underneath with a list of all login groups in the customer's system. Select a particular login group by:
- Clicking the dropdown arrow and selecting a group from the list that opens, or
- Typing the name of a group in the field and selecting one of the auto-suggestions provided. These suggestions are listed in alphabetical order.
Select at least one login group to save the metric. When a login group is selected, it displays as a blue tag in that dropdown field, positioned in alphabetical order with the other tags.
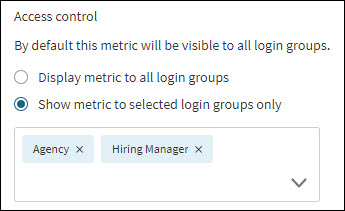
Other login groups can be added individually using this same process.
Notes:
- Selecting a parent login group also adds the individual child groups housed underneath it. Each child group has its own individual blue tag.
- Remove any selected group by clicking the X in its blue tag, or by clicking the blue tag to highlight it and then hitting Delete on the keyboard.
- Deleting a parent group from the login group list does not automatically delete its individual child groups.
- Metrics respect search lock and field permissions per login group. For instance, if a login group does not have access to a profile field used as a metric's Start or End Point variable, that group will not have access to that metric, even if it was shared with them through the TBM form.
Viewing Current Metrics
Once a metric has been saved, it displays as a row in the Your Current Metrics table. This table includes columns representing each field used to build the metric:
- Search Type: Either Job or Recruiting Workflow.
- Metric Name: The unique metric name.
- Start Point: The variable selected.
- End Point: The variable selected.
- Show To: The number of login groups selected (e.g., "8 login groups," "All login groups").
- Note: If the metric is only shared with select login groups, the text here is linked; clicking it opens a popover listing all selected login groups in alphabetical order. This menu closes when the user clicks anywhere on the screen.
- Actions: Icons to edit and delete the individual metric.
Notes:
- The Your Current Metrics table includes three preset metrics created by iCIMS and added to all customer systems: Time to Fill, Time to Hire, and Time from Apply to Hire. For more on these metrics, see About Time Based Metrics above.
- The TBM page displays a count of how many metrics have been created using this tool, out of the maximum of 25 (e.g., "7 of 25 metrics created").
- Only five metrics display at one time. Click the pagination arrows to page through the table to view all metrics.
- Metrics are displayed in the order they were created, with the most recent ones listed at the end of the table.
Editing Metrics
To make changes to a particular metric, click the Edit (pencil) icon next to that metric in the table; the information last saved for that metric repopulates in the fields below under Create a New Metric. Edit any field in the form and add and remove login groups as necessary. When finished, click Save to save all changes and overwrite the previous information.
Notes:
- The Save button is disabled until at least one edit is made.
- To cancel any changes before saving, click the Cancel button. The fields are then cleared, and no edits are saved. The Cancel button is only visible upon clicking the Edit icon.
- Clicking away from the TBM builder before saving or canceling edits prompts a message warning that all unsaved changes will be lost by navigating away.
Deleting Metrics
To completely remove a metric from the system, click the Delete (X) icon next to that metric in the table. When that icon is clicked, a window opens with a message reading "Are you sure you want to delete [Metric Name]? Deleting a metric is permanent and cannot be undone."
Note: If the metric is used as a filter or column in search/output templates, this message displays instead: "[Metric Name] is used in X number of reports. Do you want to continue?"
Clicking the Delete Metric button from this window completes the action, and a confirmation message displays. (A Cancel button is also available in this window to abandon deleting the metric.)
Once a metric has been deleted, it is immediately removed from the table and is no longer included in the count of created metrics. In addition, the metric is deleted from all reports in which it is used as a filter or output column, and it is removed as an option for selection in searching and reporting overall.
Notes:
- A message displays if the metric cannot be deleted due to an error.
- A metric cannot be deleted if it is used as a filter or output column on a search template used for integrations or scheduled reports. Therefore, to delete the metric, first remove the filter or column from the report and then proceed to delete it from the TBM page.
- Templates containing any metric from the TBM page cannot be referenced in security rules, event rules, or search locks.
Understanding How Metrics are Calculated
When a metric is implemented in the system, as discussed below, the system calculates the exact number of days—including weekends and holidays—between the Start and End Points selected for that metric, rounded to two decimal places. This number is calculated in real time.
For example, if the system starts calculating a metric on January 1 at 9:00 a.m. and stops on January 8 at 9:00 p.m., the calculation will display as 7.50 (i.e., seven and a half days between the metric's start point and end point).
For the system to produce a calculation for a metric, its Start and End Point variables must have data. If there is no data for one or both variables, the calculation for that metric will be blank. A metric will also be blank if its Start or End Point variable is hidden for the user's login group.
Notes:
- A metric calculation cannot be configured to include non-working days.
- A metric calculation that displays as a negative number indicates that the designated end point took place before the designed start point.
- If a Start or End Point variable includes a date but no timestamp, the system sets the time as 00:00 and calculates the metric appropriately.
- For timestamps, the system follows the time zone set in the organization's system.
Implementing Metrics in the System
Once a metric is created, it can then be implemented in the system—by including it in reports and/or profile factoids. Through these channels, users can view and evaluate the metric calculations and make decisions based on those numbers.
Using Metrics in Searching and Reporting
Recruiters (and system users with the appropriate search permissions) have the ability to add any created metrics as filters and output columns in Job and Recruiting Workflow searches, depending on which search type was selected for the metric.
- Job metrics are available in both Job and Recruiting Workflow searches.
- Recruiting Workflow metrics are available in Recruiting Workflow searches only.
From the filter/column picker on a search form, all metrics available to the user will be listed in alphabetical order under "Reporting & Advanced Options - [Profile Type] Time Based Metrics."
A metric will not display in the picker if it wasn't shared with the user's login group, or if its selected Start or End Point variable is a field that is either hidden or restricted for that group.
Notes:
- After creating a metric, it can take up to 30 minutes for the metric to display as an option in searching and reporting.
- To help organizations report on common time based metrics, five sample reports are accessible from the Reporting Center (Report > Reporting Center). These reports reference the three preset metrics added automatically to each customer's TBM page: Time to Fill, Time to Hire, and Time from Apply to Hire.
Adding Metrics as Filters
On a search form, click Add Filter from the Filters section to find and select a metric. Once that metric is added as a filter, enter a numeric value in the –Blank– field of the metric's row and select an operator (e.g., equal to, greater than, less than). When the search is run, it will filter results based on these criteria.
For more on search filters, see Introduction to Searching & Reporting: Filters & Subgroups.
For example, a user wants to see all jobs that took more than one week (or seven days) to get approved. On a Job search form, they can add their Time to Approve metric (outlined above) as a filter and set it as such: Time to Approve…greater than…7.00.
Adding Metrics as Output Columns
On a search form, click Add Column from the Output section to find and select a metric. Each metric has four different output columns available:
- Metric Name
- Metric Name (Max)
- Metric Name (Min)
- Metric Name (Sum)
The Max, Min, and Sum options are most useful alongside group-bys, allowing the user to view:
- The highest calculation among all items in each group.
- The lowest calculation among all items in each group.
- The total number of days combined for all items in each group.
For example, a user wants to see Time from Apply to Hire calculations for the entire organization, broken up by job category/department. They can do this through a Recruiting Workflow search by adding:
- A group-by for Total to see calculations among all categories.
- A group-by for Category to see calculations within given categories.
- An output column for the Time from Apply to Hire base metric (to see the exact calculation per job and the mean calculation per job category).
- Any of the other three output columns for Time from Apply to Hire (Max, Min, Sum).
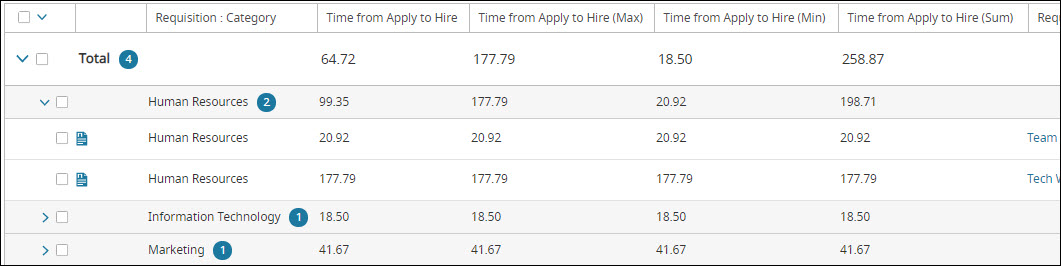
The results of the search with four Time from Apply to Hire columns.
Viewing Metrics on the Dashboard
Any report that includes a time based metric can be added to the Dashboard, just like any other report. User admins have permission to manage Dashboard configurations for any login group.
The Dashboard, the first page users see after logging in to the system, is made up of panels that provide a glimpse of key data; each panel contains one or more widgets. For metrics to display on the Dashboard, the user admin must add the time based report as a widget within a panel.
For complete steps, see Adding and Editing Panels and Widgets.
Tip: Select a panel type that displays the metric calculations in a way that is easily visible to users. Factoid and Search Preview are two panel types that work well.
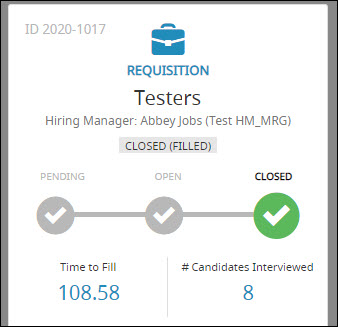
Viewing Metrics as Profile Factoids
Metrics can also be added as factoids on Job and Recruiting Workflow profiles, depending on which search type was selected for the metric. Factoids display in the profile card on the left of a profile, allowing users to quickly and easily review important information at a glance.
For example, a factoid on a Job profile referencing the Time to Fill metric will show organizations exactly how long it took to fill that job.
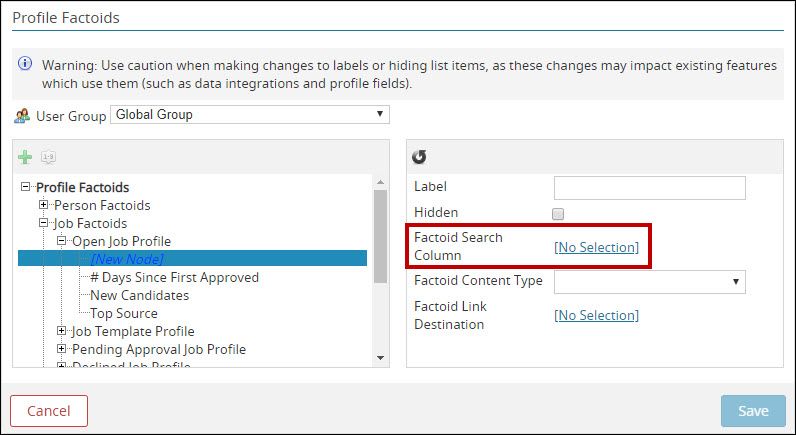
Adding Metrics as Factoids in System Configuration
Metrics are added as factoids in the same way other profile factoids are created. For complete steps, see Creating and Editing Profile Factoids.
When creating a new list item in the Profile Factoids popup, make sure to select the appropriate metric from the Factoid Search Column selector. As with filters and output columns, all metrics available to the user will be listed under "Reporting & Advanced Options - [Profile Type] Time Based Metrics."
Evaluating Metric Calculations
Although there are industry averages for standard metrics like Time to Fill, the target for a metric is really subjective; each organization has to make its own determination as to what is acceptable and what is not. This is based on a number of factors, such as the industry it is in, its hiring goals, and its budget for recruitment.
For example, although the average Time to Fill is 42 days, an organization with high turnover may prefer that jobs are filled in much less time; thus, it would consider anything around six weeks too costly.
Metrics also offer a glimpse into what is working well in the hiring process and what is not, including:
- Efficiencies and inefficiencies among departments and recruiters.
- Jobs that take up little time and investment, and ones that require more.
- Mandates/requirements that are reasonable, and ones that are too strict (e.g., jobs must be approved within X days).
Using this information not only helps inform decision-making within organizations, but also enables them to better strategize to win their war for top talent.

