Table of Contents
This article includes the following sections to introduce you to analytics in the iCIMS Talent Cloud:
Overview of Analytics
Analytics in the iCIMS Talent Cloud provide the data you need to make important, everyday decisions regarding recruiting and hiring. This data includes specific conversion metrics and key performance indicators (KPIs) that help you measure the effectiveness of your recruiting efforts and determine what pain points to address.
Analytics are available for iCIMS Applicant Tracking (ATS) and iCIMS Career Sites. They are organized by product through various dashboards, and each set of data details your organization's individual usage of that system. For instance, your organization can:
- Measure the effectiveness of your hiring sources (ATS).
- Evaluate the performance of individual landing pages on your career site (Career Sites).
Accessing Analytics
All customers that are hosted in the United States and have purchased and implemented one of the products above have access to analytics through:
- The main Analytics page at https://analytics.icims.com, which includes analytics for all three products.
- Note: This page requires a separate login; your organization must provide authorization to each user planning to log in, as discussed in Setting Up Analytics below.
- The Metrics Dashboard in ATS, which includes ATS analytics only.
- Note: Any user logged in to ATS can open analytics from the Metrics Dashboard; no separate login or authorization is required. For more information, review Logging in to Analytics for ATS below.
Setting Up Analytics
Individual users must be verified and authenticated to use the main Analytics page, ensuring that only those with the proper authorization can log in. Your organization can work with iCIMS to create, delete, update, and block users as necessary.
Notes:
- If desired, your organization can use your own identity provider for authorization (e.g., Microsoft Active Directory). For assistance in setting this up, user admins can submit a case to iCIMS Technical Support.
- Analytics are not available for customers outside the U.S. at this time.
Adding New Users
Each employee at your organization who needs access to the main Analytics page must be manually added as an authorized user by iCIMS. This allows them to properly authenticate into the platform.
To add a new user, user admins can submit a case to iCIMS Technical Support with the user's first name, last name, and email address. iCIMS will provide that person with a temporary password; they'll then receive an email to reset their password and log in.
Mapping Data for ATS Analytics
For ATS analytics to populate, user admins must first map their bins and statuses to a hiring stage via Admin > System Configuration > Applicant Tracking > Configure > Workflow > Recruiting Workflow Bins and Statuses.
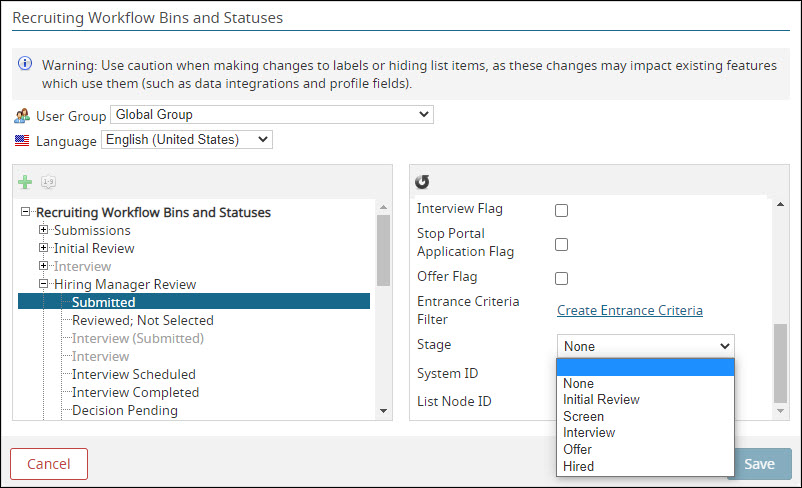
From this window, the user admin highlights a bin or status on the left and then selects an option from the Stage dropdown on the right. Options include:
- Initial Review
- Screen
- Interview
- Offer
- Hired
Mapping bins and statuses enables the system to collect data points (e.g., source fields) for every recruiting workflow change that is made. The system uses these data points to compute the analytics on the three ATS dashboards: Source, Pipelines, and DEI Analytics. For more information, review Logging in to Analytics for ATS below.
Note: Currently, these dashboards report on data mapped after March 1, 2020 only.
Logging in to Analytics for Career Sites
If you are an authorized user, you can access Career Sites analytics by navigating to https://analytics.icims.com. Enter your email address and password and select Log In. If your login is successful, you are directed to the main Analytics page.
If your organization uses its own identity provider and you are already logged in to its single sign-on (SSO), the Email and Password fields will not be available; instead, there will be a single Authenticate button. Select this button to go directly to the main Analytics page.
Note: The system will automatically log you out after a period of inactivity.
Logging in to Analytics for ATS
ATS analytics are available from the main Analytics page; the login and authentication process is the same as described above.
For quicker access, you also have the option to view these analytics directly from the Metrics Dashboard in ATS. This does not require separate authorization or a separate login; you just need to be logged in to ATS. (For more on how to log in to ATS, review the article Logging In and Out of iCIMS Applicant Tracking.)
The Metrics Dashboard allows all ATS users to review high-level metrics pertaining to specific areas of ATS. The summarized information displayed gives users an overview of the data contained within ATS and is available across all login groups.
To access analytics while logged in to ATS:
- Select the Metrics Dashboard (pie chart) icon in the menu bar at the top left.
- Select Applicant Tracking from the left-side menu.
- Select any of the desired tabs, such as Source, Pipeline, or DEI Analytics. (These are same dashboards as on the main Analytics page.)
Notes:
- In particular, the Source, Pipeline, and DEI metric dashboard types include the following:
- Getting Started page: Allows users to understand the purpose of the dashboard and where the data comes from.
- Dynamic filters: Allows users to modify what field they are using to generate metrics.
- Drill downs: Allows users to drill into a metric to get more details (where applicable).
- Metrics for other products, such as iCIMS Connect (Legacy CRM) and Onboarding may also be available depending on the iCIMS solutions to which your organization subscribes.
- The DEI Analytics tab in the Metrics Dashboard is disabled by default but can be enabled by submitting a case to iCIMS Technical Support.
- User admins can enable or disable any of these dashboards for specific user groups by opening ATS and going to Admin > System Configuration > Analytics > Platform Settings > Enable Dashboard.
Tip: For analytics to display effectively within ATS, make sure that third-party cookies are allowed in your browser. Navigate to your browser's privacy and security settings to unblock these cookies, if necessary. (For instructions, review the following articles: Google Chrome, Safari, Microsoft Edge, Firefox.)
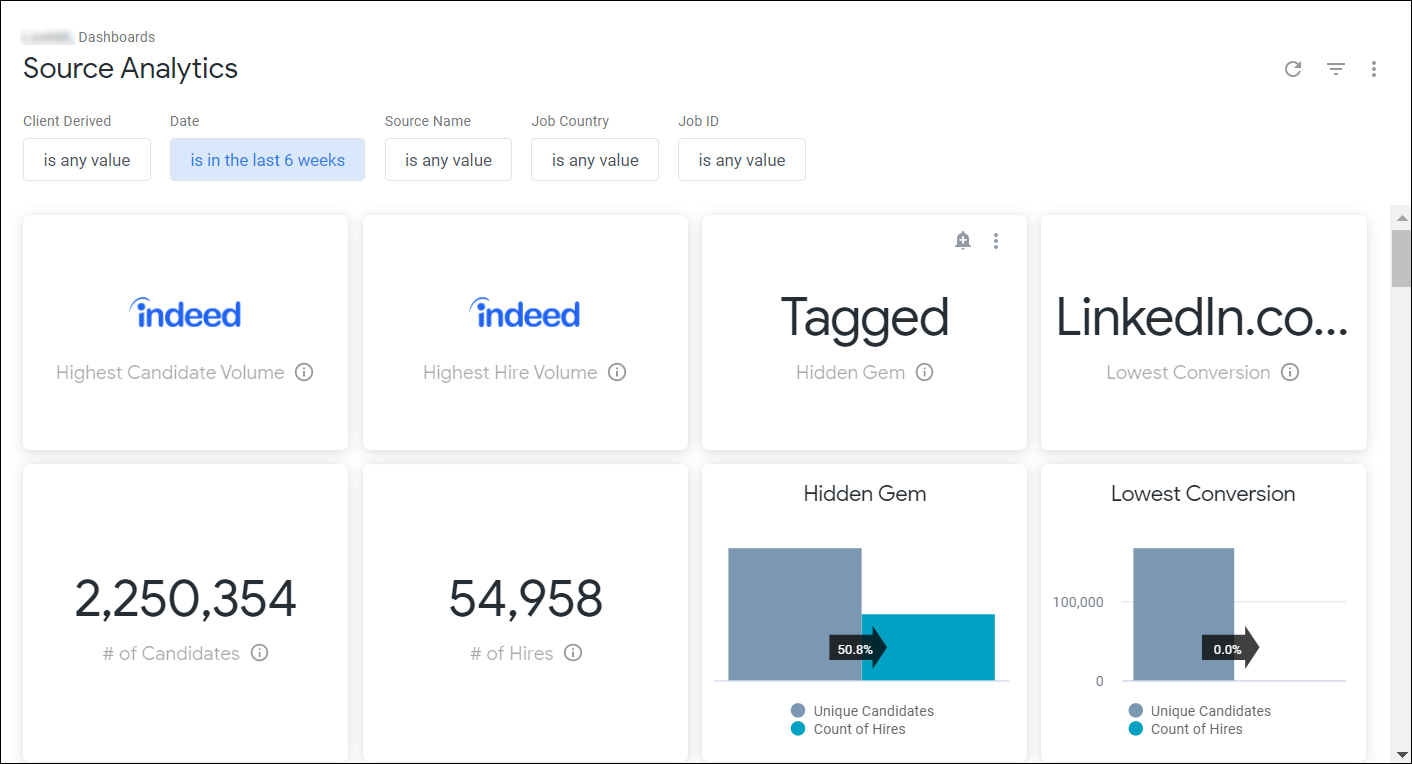
Viewing Analytics Dashboards
To open a dashboard, select a dashboard title from the main Analytics page. Or, if you're in the Metrics Dashboard in ATS, open one of the ATS dashboards using the steps above.
Each dashboard includes various tiles of data, consisting of tables, graphs, and factoids.
Understanding the Dashboard Menu
Near the top of each dashboard is a menu with the following elements to manage and filter the displayed data:
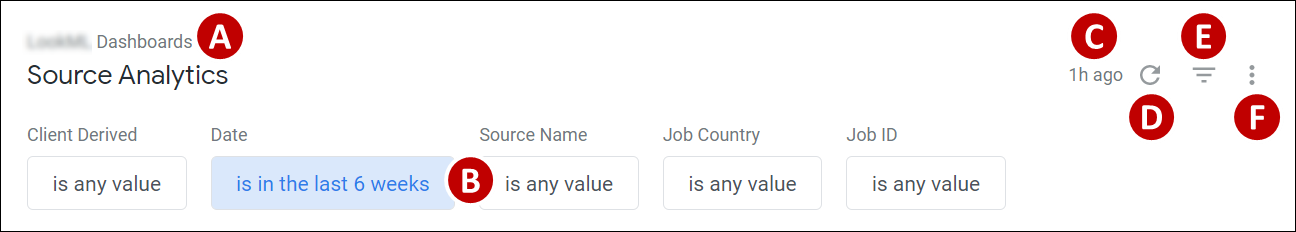
- Dashboards: A link to open any of the other dashboards available to you.
- Filters: A row with all current filters assigned to the dashboard. When you use filters on a dashboard, they apply to all tiles on that dashboard. To edit a dashboard filter, select the box for that filter and make adjustments as appropriate. For more on using filters, review Filtering Dashboard Data below.
- Timestamp: The time since the dashboard last had an update.
- Reload: An icon to re-run the dashboard for the most up-to-date data. When you edit a filter, this icon turns into a blue Update button to run the dashboard with the updated filter(s) applied.
- Note: While the dashboard is reloading, this button becomes an X icon allowing you to cancel and stop the reload.
- Hide Filters: An icon to hide the row of filters.
- Dashboard Actions: An icon to take certain actions on the dashboard, such as Clear Cache & Refresh, Download, Schedule Delivery, and Reset Filters. For more information, review Taking Action on Dashboard Data below.
Tip: When viewing a dashboard, make sure that your usage of the relevant feature is sufficient. If you have not used a feature, then a portion of the dashboard may show zero results.
Warning: Make sure your configurations are correct in your product before gathering data. iCIMS cannot guarantee that adjustments can be made to data after it has already been gathered.
Filtering Dashboard Data
You can modify the filters on any dashboard. To filter dashboard data, select the box for any filter at the top; this opens an editable row directly underneath. Enter or select values in the field as provided, and use the operator dropdowns to define what you need (e.g., starts with, is before, is equal to).
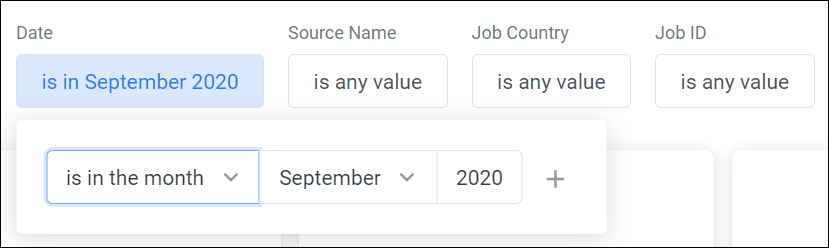
Consider the following example: You want to use the ATS dashboard Source Analytics to find source data from September 2020. Navigate to that dashboard and locate the Date filter at the top. Set the operator to is in the month and input September 2020.
Notes:
- If one or more tiles do not update when you modify a filter, the filter may not apply to those tiles.
- When you open certain filters, an Add (+) icon may be available to insert additional rows, allowing you to filter results using multiple conditions and values.
Taking Action on a Dashboard
There are several actions you can take to make better use of the data on a dashboard, such as downloading it or emailing it to yourself or others for future reports and presentations. While most actions are applied to the dashboard as a whole, certain actions can be applied to individual tiles.
To take action on an entire dashboard, use the Dashboard Actions icon at the top right of the menu. Among the options available from this button are:
- Clear Cache and Refresh: To clear data from your browser's cache to improve system performance.
- Download: To download the dashboard in PDF format or as a zipped collection of CSV files.
- Schedule: To schedule periodic delivery of your dashboard via email.
- Reset Filters: To reset the filters on that dashboard to their default values.
To take action on an individual tile, hover your mouse over the tile. Two icons will display at the top right:
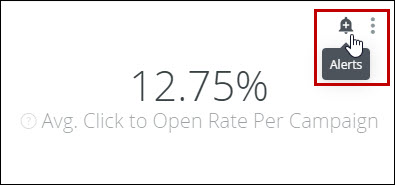
- Select the bell (alerts) icon to set up email alerts for that tile, which notify you if certain conditions for that tile have been met. For instance, on the Campaigns and Emails dashboard, you can set an alert for the Open % (All Emails) tile to let you know if it has exceeded 15 percent. Alerts can be scheduled on an hourly, daily, weekly, or monthly frequency.
- Select the three vertical dots icon to select any of these available actions:
- Download Data: To download the tile data in one of many file formats.
- Clear Cache and Refresh: To force new results to be retrieved for that tile.
Using Analytics Data
To learn more about the data offered through analytics, review the article Using and Understanding Analytics Dashboards, which provides descriptions and insight on the dashboards and tiles available from the main Analytics page.

